Interpreting power flow results
Power flow results appear as annotations on your diagram components. This guide explains how to read and interpret each result type.
Understanding severity colors
All annotations use color coding to indicate operating conditions:
| Color | Meaning | Voltage Range | Loading Range |
|---|---|---|---|
| Green | Normal operation | ±3% of nominal | ≤90% |
| Yellow | Warning condition | ±3% to ±5% | >90% to 100% |
| Red | Critical condition | >±5% | >100% |
| Gray | Stale results | - | - |
Green indicates healthy operation within design margins. Yellow suggests the component is approaching its limits. Red means the component violates design criteria and needs attention.
Gray annotations indicate the results are outdated because you modified the diagram after running the analysis.
Reading voltage annotations
Voltage annotations appear on buses and show the calculated bus voltage.
Per-unit display:
- Shows voltage as a fraction of nominal voltage
- Example:
0.98 pumeans 98% of rated voltage - Easier to spot voltage issues across different voltage levels
Engineering units display:
- Shows actual voltage in kV or V
- Example:
470 Von a 480 V bus - Matches equipment nameplate values
Voltage angle:
- Shown in degrees relative to slack bus
- Example:
-2.3°indicates the bus lags the reference by 2.3 degrees - Important for power flow direction and stability analysis
Voltage deviation thresholds
The system applies standard voltage deviation limits:
±3% threshold (green to yellow):
- Acceptable for most distribution equipment
- Within ANSI C84.1 Range A limits
- No immediate action needed
±5% threshold (yellow to red):
- Approaching equipment voltage limits
- May cause motor heating or lighting flicker
- Investigate voltage drop issues
- Consider transformer tap changes or voltage regulators
Examples:
On a 480 V system:
0.97 pu(465.6 V) = Yellow (>3% low)0.92 pu(441.6 V) = Red (>5% low)1.04 pu(499.2 V) = Yellow (>3% high)1.06 pu(508.8 V) = Red (>5% high)
Reading cable current and loading
Cable and line annotations show the current flowing through the conductor and the loading percentage.
Current display:
- Shows magnitude in kA or A
- Example:
1.2 kAmeans 1,200 amperes - Does not show direction (use power flow arrows if enabled)
Loading percentage:
- Calculated as: (actual current / rated ampacity) × 100%
- Example:
85%means conductor carries 85% of its rated capacity - Based on cable ampacity at 75°C per NEC termination limits (not the 90°C manufacturer rating)
Loading severity thresholds
≤90% (green):
- Normal operating range
- Adequate margin for load growth
- Conductor operates well below thermal limits
>90% to 100% (yellow):
- Approaching rated capacity
- Limited margin for additional load
- Review for future expansion needs
- Verify derating factors applied correctly
>100% (red):
- Exceeds rated ampacity
- Conductor may overheat
- Violates NEC 215.2 and 310.15
- Requires larger conductor or load reduction
Cable annotation example
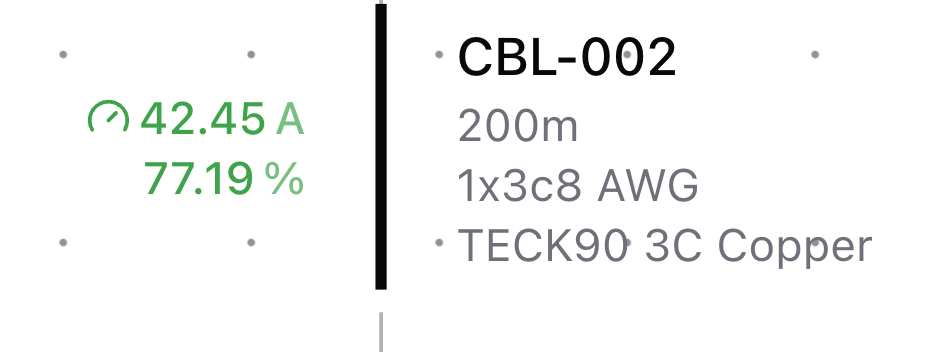
The cable annotation displays:
Current (42.45 A):
- Shown in green with a meter icon
- Indicates 42.45 amperes flowing through the cable
- Green color means current is within normal operating range
Loading percentage (77.19%):
- Calculated as (42.45 A / rated ampacity) × 100%
- Green indicates healthy loading (≤90%)
- Adequate margin exists for load variations
Cable identification (CBL-002):
- Component name for reference in reports
- 200m length shown for documentation
- 1x3c8 AWG configuration (1 run of 3-conductor 8 AWG)
- TECK90 3C Copper series specification
This example shows normal cable operation with appropriate sizing. The 77.19% loading provides margin for:
- Future load growth
- Temporary peak demands
- Derating factor safety margins
If this cable showed 95% loading (yellow), you would review whether additional load growth is planned. At 105% loading (red), you would need to increase the conductor size or reduce the load.
Reading transformer results
Transformer annotations show loading percentage and currents on both sides.
Loading percentage:
- Calculated as: (actual kVA / rated kVA) × 100%
- Based on apparent power through transformer
- Example:
78%means transformer operates at 78% of nameplate rating
HV current (primary side):
- Current on high voltage winding
- Example:
45 Aon 13.8 kV side
LV current (secondary side):
- Current on low voltage winding
- Example:
1,150 Aon 480 V side - Higher current due to lower voltage (same power)
Transformer loading thresholds
≤90% (green):
- Normal operating range
- Transformer runs cool
- Room for load growth
>90% to 100% (yellow):
- Approaching nameplate rating
- Monitor temperature rise
- Limited headroom for peak loads
>100% (red):
- Exceeds nameplate kVA
- May overheat and reduce transformer life
- Check for sustained overload vs brief peak
- Consider larger transformer or load shedding
Reading generator results
Generator annotations show loading percentage and power output after power flow analysis.
Loading percentage:
- Calculated as: (actual output / rated MVA) × 100%
- Example:
65%means generator operates at 65% of nameplate capacity - Color-coded: green (≤90%), yellow (>90% to 100%), red (>100%)
Active and reactive power output:
- Real power output in MW
- Reactive power output in MVAR
- Shows how much the generator contributes to the system
Loading thresholds:
- Green (≤90%): Normal operating range with headroom for load changes
- Yellow (>90% to 100%): Approaching rated capacity, limited reserve margin
- Red (>100%): Exceeds nameplate rating, risk of overheating or trip
> Note: In systems without a utility feed, the generator acts as the slack bus and balances all system power. Its loading depends entirely on the connected loads.
Reading cable voltage drop
Cable annotations include voltage drop data from power flow analysis:
Voltage drop percentage:
- Shows the voltage lost across the cable length
- Calculated from the difference between sending and receiving end voltages
- Example:
2.1%voltage drop
Voltage drop significance:
- Feeders: aim for less than 2% drop
- Branch circuits: aim for less than 3% drop
- Combined (feeder + branch): aim for less than 5% total drop
These are NEC recommendations, not mandatory requirements. If power flow shows excessive voltage drop, upsize the conductor even if ampacity is adequate.
Reading protection device results
Protection device annotations show loading and continuous duty rating after power flow.
Rated loading:
- Calculated as: (actual current / device rated current) × 100%
- Based on the full device rating
Derated loading (LV breakers):
- Low-voltage breakers are derated to 80% continuous duty per NEC 240.6
- A 100 A breaker has 80 A continuous capacity
- Derated loading shows current as a percentage of the 80% continuous rating
- Example: 70 A through a 100 A breaker shows 70% rated loading but 87.5% derated loading
> Note: When you see two loading percentages for a breaker, the derated value is the one to watch. A derated loading over 100% means the breaker cannot carry that current continuously.
Reading load annotations
Load annotations show the power consumed by the load and the terminal voltage.
Current:
- Actual current drawn by load in A or kA
- Example:
125 A
Active power:
- Real power consumption in MW or kW
- Example:
50 kW - Should match your load specification if voltage is nominal
Reactive power:
- Reactive power consumption in MVAR or kVAR
- Example:
30 kVAR - Depends on load power factor
Terminal voltage:
- Actual voltage at load connection point
- May differ from bus voltage due to cable voltage drop
- Example:
470 Von a 480 V nominal load - Red if voltage is too low for equipment
Load terminal voltage significance
Terminal voltage shows the actual voltage delivered to equipment:
- Motors may fail to start if terminal voltage <90% nominal
- Lighting output reduces with low voltage
- Electronic equipment may malfunction below 85% nominal
- Excessive voltage causes equipment overheating
Example:
A motor specified for 480 V showing terminal voltage of 440 V:
- Voltage is 91.7% of nominal (yellow or red depending on threshold)
- Motor may overheat or fail to develop rated torque
- Indicates excessive voltage drop in supply cable
- Action: Increase cable size or check connections
Identifying violations
Scan your diagram for red annotations after power flow completes. Red annotations indicate:
Voltage violations:
- Undervoltage: Increase cable size, adjust transformer taps, or add voltage regulators
- Overvoltage: Check generator voltage settings, verify transformer tap position
Current violations:
- Cable overload: Increase conductor size or reduce load
- Verify cable installation type and derating factors
Transformer violations:
- Overload: Install larger transformer or reduce connected load
- Check if overload is continuous or peak demand
Stale results indicator
When annotations appear gray with "stale" indicator:
- Results are from a previous calculation
- Diagram has changed since last power flow run
- Values may no longer be accurate
- Click Run Power Flow to update results
Never rely on stale results for design decisions or compliance verification.
Related topics
- Understanding power flow - What power flow calculates
- Running power flow - How to run analysis
- Troubleshooting convergence - Fixing analysis issues
- Cable sizing - Sizing conductors based on power flow results